P-Hacking
As a follow-up to my post about p-values, I wanted to write about "p-hacking," entirely because it's a cool term. And I guess because it's also an important concept to understand how statistics can be used to lie to you? That too.
Very briefly: what conclusions you can draw from a set of data changes based on what you predicted before gathering it. If that sounds non-intuitive, don't worry, it is for me too. I hope I can explain why it's true.
To briefly recap, a p-value is just "what are the odds this outcome could be simply be the result of random chance?"
Keep in mind that studies can be thought of as proving you can predict something, because you understand the way the world works. I know how inheritance works: therefore I can predict which pea plants will grow taller. I know how intelligence works: therefore I can predict which rats will navigate the maze faster. By correctly predicting outcomes, you can prove your understanding is accurate.
Back to p-values, let me work through an example. I claim I've developed a medicine which will make flu patients recover faster. I administer my medicine to some patients and a placebo to other patients, and predict the patients who received the medicine will recover faster. Now I have two groups, and after measuring their recovery times, I find that the medicine-receiving group did, on average, recover faster. That's a good start! My prediction was right!
But what if my medicine doesn't actually do anything? What if the patients in the medicine group just happened to recover faster by chance, due to variation in recovery times? My prediction would look right, when I actually just got lucky.
To test for that, I first assume my medicine did nothing. If my medicine did nothing, then my criteria for sorting people into two groups was essentially random; my medicine was no better than the placebo, so my sorting turned out to be between placebo-or-other-placebo. As a result, I would expect to see just as much difference between the groups if I actually assigned them randomly.
Following that logic, I then shuffle the patients around randomly and see if one group still beats the other by as much as it did as when I sorted them by medicine-or-placebo. Or rather, I try to consider every possible shuffling and see in how many the effect is just as strong.
What we want to see is that "received the medicine" is a good predictor for "recovered faster." If we see the same kind of "faster recoveries" when we pick patients at random as when we specifically pick patients who received the medicine, it becomes impossible to conclude the medicine actually did anything.
"p-value" is just "in what percent of those shuffles does the effect remain just as large"? High p-values are worse for the conclusion of the study: the higher the p-value, the harder it is to distinguish the original criteria from a random shuffle.
If my p-value = 0.05, that means in 95% of the shuffles, the effect vanished (or at least diminished). That would be a solid result! It would mean my data was very "well-organized" to begin with: specifically, that I have the faster recoveries in one group, and the slower recoveries in the other. As a result, nearly any random change I might consider will weaken the observed effect. That suggests the original criteria was meaningful, and thus that my medicine really accelerated the healing process.
So that's a recap of p-value. Now let's talk about p-hacking.
Now, imagine I finish my data analysis, and while the medicine group did recover faster on average, my p-value is a whopping 0.40. Uh oh! Turns out shuffling my results doesn't reliably result in a weaker effect. That suggests my criteria isn't much better than random assortment, and thus we can't safely conclude that my medicine actually improved recovery times.
Undaunted, I look closer... and notice that if I only include patients who can curl their tongues (my intake forms are very thorough), my p-value falls to 0.01 -- an extremely statistically significant result!
I gleefully conclude that my medicine does work, but only on people who can curl their tongues. After all, a 1% chance is way too small to write off as random chance. Right?
Right?
What's the problem here?
The problem is I just performed p-hacking. Dang! The one thing I was trying not to do in this post about p-hacking! Unless I went into the study with the stated belief that my medicine would work better on people who can curl their tongues, I can't present my finding as meaningful, despite its impressive-looking p-value.
But how does that work? The data is the same either way. Why does it matter that I didn't predict that particular effect in advance?
Let's try some thought experiments. To help me out, I'm going to be relying on my two assistants, both of whom are possibly just Quill with brushed or unbrushed hair:

Quilliam is a good and honest chap, who would never attempt to mislead you by manipulating his data analysis to create the illusion of statistical significance where none exists. The same cannot be said for his scrungly counterpart, Quit (as in, "Hey! You're performing p-hacking! Quit doing that!"). For each thought experiment, Quilliam and Quit will attempt to impress you by manipulating chance, whether by magic or by illegitimately interpreting statistics
X
Let's try one now:
Quilliam tells you he can magically influence a d100 to make it roll exactly 28 most of the time. (His horn's powers are very specific, it seems.) He demonstrates by rolling a d100, and gets a 28. "Aha," he says, "There was only a 1% chance of rolling exactly 28!"
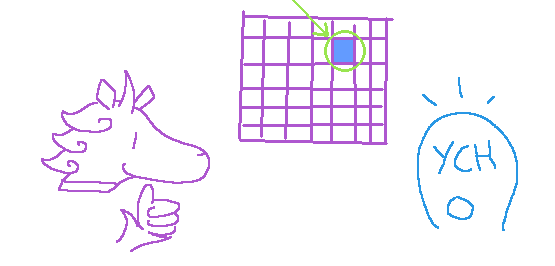
Would you be impressed?
Alternatively, Quit tells you he can magically influence the outcome of rolling a d100. Without making any actual prediction, he rolls a d100 and gets a 64. "Aha," he says, "There was only a 1% chance of rolling exactly 64!"

Would you be impressed?
Hopefully, you agree with me: Quilliam's result is impressive, while Quit's isn't.
Quilliam correctly predicted a result so unlikely you might be willing to believe it was caused by something other than pure chance. Whether that's magical powers or using a loaded dice isn't clear, but it's probably not just luck. If you weren't convinced yet that it wasn't purely random, you could ask Quilliam to repeat the feat: maybe a 1% chance isn't enough for you to start believing in magic d100 horn powers, but if Quilliam can hit 28 two times in a row, that becomes a 0.01% probability of Quilliam's rolls being nothing but chance.
Meanwhile, Quit's predicted nothing. Yes, getting a 64 on a d100 is only a 1% chance, but that's true of every result. Quit didn't predict that he'd roll a 64, so any number would have worked. And the odds that he'd roll "any number" is 100%!
Quit could try to trick you by saying 64 is a notable result, because it's a square number and the number of spaces on a chess board. He didn't just roll any number, he protests, he rolled a cool number.
Again, this is nonsense. What is a "cool" number? How many cool numbers are there between 1 and 100? I feel like I could come up with something cool about nearly any number! Why didn't Quit specify the "cool numbers" before he rolled the die? Even if Quit had specifically predicted a "cool" result, his opportunities for success would've been "however many cool numbers there are." Decidedly less impressive than 1%.
To summarize:
Let's try another thought experiment.
Quilliam tells you he can magically control a coin flip to almost always come up heads. To demonstrate, he flips a coin 7 times, and gets 7 heads. "Aha," he says, "There was only a 1% chance of getting 7 heads in a row!" (Or a 1/128 chance, to be precise.)
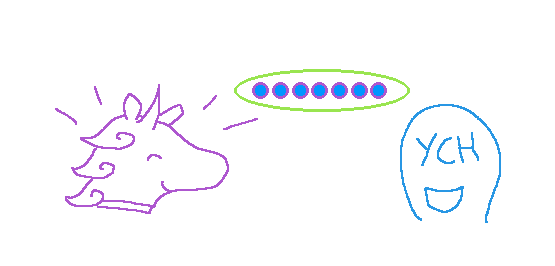
Would you be impressed?
Alternatively, Quit tells you he can magically control a coin flip to almost always come up tails. To demonstrate, he flips a coin, and gets an even mix of heads and tails in seven flips. And then he just keeps on flipping it. He hits the occasional streak, but isn't deterred when that streak gets broken. Finally, hundreds of flips later, he ends up getting 7 tails in a row. "Aha," he says, "There was only a 1% chance of getting 7 tails in a row!"
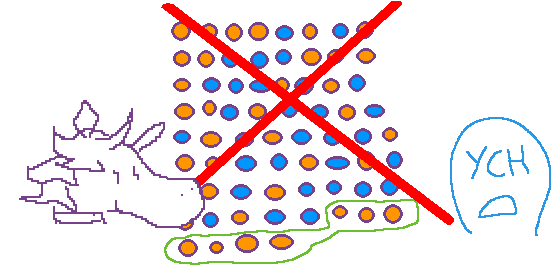
Would you be impressed?
Again, hopefully you agree that Quilliam's result is impressive and Quit's result isn't.
Just like the previous thought experiment, Quilliam managed to accurately predict something unlikely enough that you should be open to the possibility that it was more than just chance. I wouldn't fault you for wanting to check to make sure he's not using a double-headed coin, but I think it's fair to say what you're observing is hard to write off as pure 50/50 randomness. And like in the first thought experiment, if you weren't convinced yet, you could ask Quilliam to repeat his demonstration. Even if he doesn't maintain his perfect streak, a high enough rate of heads could convince you further.
In Quit's scenario, though, he chose an arbitrary subset of his data which he knew looked notable in isolation and then threw everything else out. This time around, he did actually name the "notable" event he was looking for beforehand, and instead cheated by arbitrarily excluding any data that didn't fit with his prediction.
Prior to flipping them, there was nothing special about the seven flips that he eventually tried to say proved his claim. He instead gave himself effectively infinite chances, then after-the-fact picked seven flips that, on their own, appear notable. A 1% chance isn't impressive when he's given himself infinite chances to hit it: Given enough time, a 1% chance goes from being impressive to inevitable!
Getting dealt a 3-of-a-kind in 5 poker cards is especially lucky. Having once been dealt a 3-of-a-kind after playing hundreds of hands of poker is not especially lucky.
Time to update those lessons:
One more thought experiment.
Quilliam tells you he has a magic power which lets him influence (but not perfectly control) coin flips to come up as heads, but for some reason it only works on nickels minted during a leap year. That sounds strange, but you go ahead and let him demonstrate for you.
He proceeds to pull out 10 leap year nickels and flip them all, 9 of which come up as heads.
"You see?" he says to you. "There was only a 1% chance of getting at least 9 heads out of 10 on my leap year nickels." (The math is simple, in this case: 10 flips means 210 possibilities, or 1024. Exactly 11 of those meet our prediction: 10 cases where we got only a single tails, plus 1 where we got zero tails. 11/1024 is very nearly 10/1000, or 1/100.)
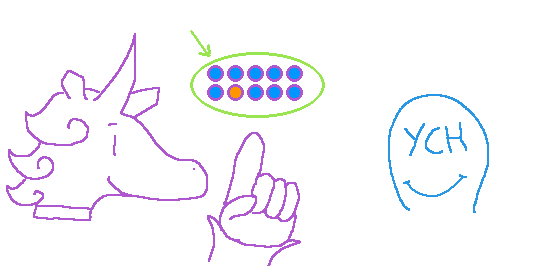
Would you be impressed?
Alternatively, Quit tells you he has a magic power which lets him influence (but not perfectly control) coin flips to come up as tails. Again, you go ahead and let him demonstrate for you.
He proceeds to pull out a sack of 200 coins and throws them all at your face.
The coins end up scattered all over the floor. After several tedious minutes spent sorting the coins on the ground, you end up counting exactly 100 tails. Unimpressed, you start to walk away.
But before you do, Quit asks you to wait while he examines the results more carefully. He proceeds to sort the coins by their denomination, and finds:
- pennies: (18 tails out of 40)
- nickels (23 tails out of 40)
- dimes (19 tails out of 40)
- quarters (21 tails out of 40)
- half-dollars (19 tails out of 40)
He points out the nickels, saying getting 23 tails out of 40 flips should only happen 21% of the time.
You're still not impressed. He hit a ~21% chance in 5 groups, which is perfectly typical, statistically. Again, you start to walk away.
Again he stops you! He looks carefully at the nickels, considering various criteria (Minted before or after 1985? Minted during an even- or odd-numbered year? Minted during a Democratic or Republican presidency? etc.) and finally realizes that if you sort them by whether or not they were minted in a leap year, you have leap year nickels (9 tails out of 10) and non-leap year nickels (14 tails out of 30).
"You see? There was only a 1% chance of getting at least 9 tails out of 10 on my leap year nickels," he brags.
Would you be impressed?
Once again, I hope you are impressed with Quilliam's result and not with Quit's. In both cases, they only looked at leap year nickels, but it was only Quilliam that named the effect before he gathered the data. There's no reason to think he wouldn't get similar results if he were to re-flip the 10 coins in the first example, but you would be right to assume Quit's supposed "leap year nickel" mastery would vanish were he to flip them again in the second.
In the second case, if he had predicted the effect would be limited to leap year nickels prior to throwing the entire bag of 200 coins, then that would be impressive. That would be an actual prediction! (It still wouldn't excuse him throwing them in your face, however.)
Another way to think about it: in Quit's case, he managed to find a way to divide up the data to locate a 1% result. But there were nearly infinite ways for him to divide up the data! A 1% result is nothing special when you have infinite data slices in which to go hunting for it! Just like in the 2nd thought experiment, he had enough opportunities to make that 1% chance inevitable.
There was nothing special about leap year nickels prior to flipping the coins: given enough time and an arbitrarily complex definition, Quit could have inevitably come up with a criteria for including all of the 100 tails and none of the heads! "The effect is limited to coins that landed during a millisecond with a tens digit divisible by 4 and that bounced an odd number of times but not 5 times unless they were minted during 1982, or that landed during a millisecond--"
Even if Quit didn't want to get that fancy, there's 32 ways he could make a subset of the coins by denomination alone ("just pennies," "just nickels," "pennies and nickels," "just dimes," "pennies and dimes," "nickels and dimes," "pennies, nickels and dimes," etc.). If he starts considering ways of splitting them up by minting year, that's already hundreds or thousands of (admittedly not-independent) opportunities to find a 1% result.
Or he could just skip the facade and go, "Those 100 tails, that's my data set." That would be the same kind of cheating, just undisguised.
Now, if Quit wanted to use these results as a jumping-off point for trying to determine if he really does have leap year-nickel powers, that would be fine! There's nothing illegitimate about seeing something unexpected in a data set and wanting to determine if it's a fluke or something real.
This is where repetition comes in, again: if this really is Quit discovering his affinity for leap year nickels, then he should be able to repeat the result in a follow-up study. (Hopefully he can spare your face the next time around.)
Also I suppose it's possible to hit a result so impossibly unlikely that even being able to custom-fit criteria can't explain it. Like if he threw those 200 coins and every single leap year nickel landed on its side, then even "thousands of opportunities" might not be able to explain that sufficiently. It'd have to be way out there, though.
We can conclude our lessons now:
* For example, "leap year nickels" looks more legitimate than "these seven coin flips that I hand-picked," but is still custom-fitting the results to the prediction.
We're through our thought experiments! Congratulations on making it this far. So, what was the common cheat that Quit pulled in all three examples?
Each time, what Quit did was give himself hundreds or even infinite chances to succeed, then plucked out a single instance of success and said, "wow, what are the odds?"
That's the essence of p-hacking.
Going back to my medicine example, there are plenty of ways I could choose to divide up my patients, beyond medicine-or-placebo. Do men experience more of an effect than women? Young vs. old? Is weight a factor? Physical fitness? Diet? Sleep schedule? Ethnicity? Level of education? Handedness? Tongue-rolling? Even given a limited subset of plausible criteria ("it works better on young people" is an easier pill to swallow, forgive the idiom, than "it works better on left-handed people"), introducing that kind of criteria after-the-fact gives me dozens or hundreds of bonus chances to find my p <= 0.05 jackpot.
"I predicted this unlikely outcome!" is impressive. "If I had predicted this outcome, that would've been unlikely!" is not. Hacking your data into chunks to find the most unlikely outcome and then presenting it like you predicted anything is not legitimate.
Remember that the basic definition of a p-value is "how likely would it be for the data to have shaken out this way if the groups were chosen randomly instead of by the criteria we're investigating"? Getting a p-value of < 0.05 is not some magical threshold beyond which a hypothesis is Proven . All p-value <= 0.05 is saying, quite literally, is that there's only about a 5% chance the results happened randomly. So that means you need to fully expect that some impressive-looking results are merely chance, and nothing more!
If you roll a d20 fourteen times, the odds are better than not that you'll get at least one natural 20, which is a 5% chance. Likewise, if you look at 14 results, all of which have a p-value of exactly 0.05, it's more likely than not that one of those "statistically significant" results really is just random chance! And that's when you aren't going out of your way to find the most improbable-looking subslice of the data!
This is why repeatability is key, and why I've mentioned it in all three examples. If an effect is real, it'll be repeatable. That's why you should always take studies with a grain of salt, especially when dealing with second-hand sources that might elide the hacky details.
A headline that says, "Men are better than women at chess," might be leaving out, "...according to one study performed in one country and limited to a particular, arbitrary band of ELO scores." All the hackiness gets erased in favor of "well they found a bigger mean, didn't they?"
Like I said, take how studies are reported with a grain of salt.
Going back to what I said at the beginning of the post, I really enjoy the concept of p-hacking because it's counter-intuitive for me. How can data either point or fail to point to a conclusions based on predictions made by the researchers before the data is gathered? Surely, if the data shows an effect, then that effect is present regardless of what anyone predicted, right?
But that's falling for the same kind of logical pitfall as the "64 on a d100" thought experiment. Finding the one meaningful effect you were looking for is impressive; finding some meaningful-looking effect out of dozens or hundreds is so very much less so.
I think that's it! I hope you enjoyed this. Thanks for reading all the way through. I put way more work into this than I meant to, oops. Let me know what you thought; I'd appreciate any feedback or questions you have!
